Observation #26
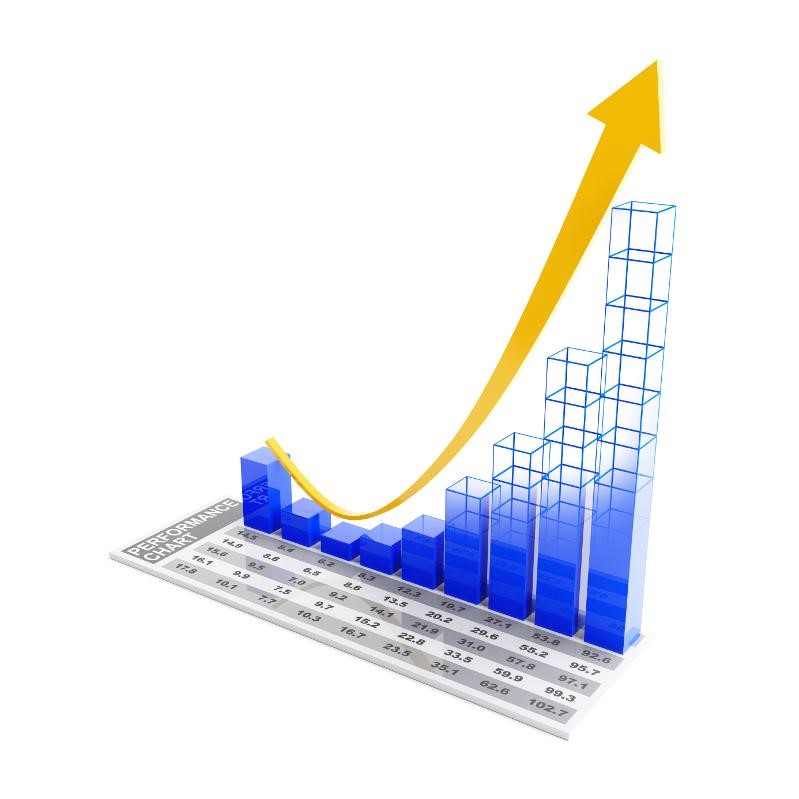
 The “hockey-stick forecast” is a fairly common concept for people who deal regularly with future plans of one type or another. This is the trend graph that shows a general downward trend in performance in the past few periods’ actual results, and then a sudden and dramatic upturn in forecast results. It looks like a hockey stick. The business world is full of strategic plans littered with charts like these.
When we review a business to understand where it is coming from or headed, one of the things we pay close attention to is if there are any “hockey-stick forecasts” in its budgets. They are often buried within the numbers, so we often need to do some digging.
We find “hockey-stick forecasts” where performance in an area is expected to improve dramatically year over year. The fact that performance is expected to improve is not as much the issue as trying to understand the underlying logic as to why it will improve. What you have to decipher is if the improvement is related to changes in the product or service mix, margins or productivity.
Sales forecasts are a common “hockey-stick”. If sales are expected to increase by any amount greater than what has been demonstrated over the past few years, you need to understand the underlying drivers of that improvement. Sales forecasts are often driven by the optimism of salespeople and their customers, but implicit in sales growth is a myriad of sub-drivers and corresponding activities. Here are just a few questions that can be helpful when trying to understand where sales growth is expected to come from:
- Will the growth come from existing or new customers? If new, what marketing or sale activities will increase or improve?
- Is the growth from existing or new products or services? Existing or new markets served? Larger order sizes?
- Is the market growing or is business being taken away from competitors? How will this impact pricing and margins?
Hockey-stick forecasts can be very useful analytical flags to help you better understand underlying operating assumptions. You can also check to see if management has the necessary tools to measure and track those assumptions. When companies struggle to hit their budgets, you’ll often find a few gaps between what was planned and what was actually managed.